Summer Success Series: Data Analysis Deep Dive

Step 1: Look at Traffic and Channels in Google Analytics
Google Analytics can tell you so much about your website and your actual customers. It can help you confirm your gut feelings about your audience, or change your opinion entirely with cold, hard data.
Where is my audience coming from?
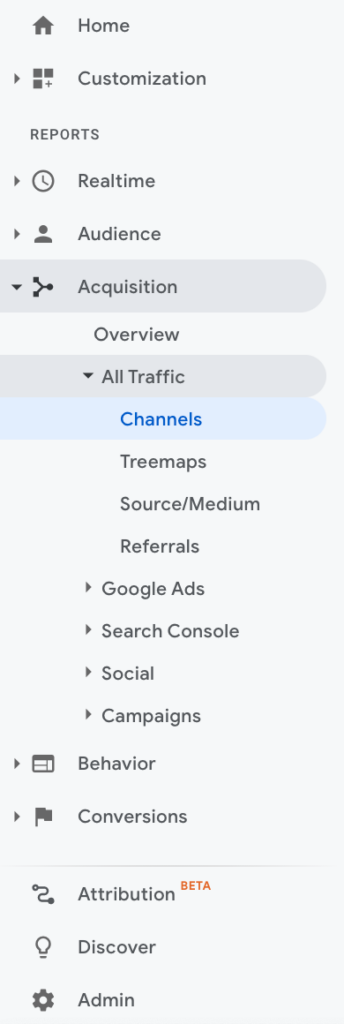
We talked about customer personas and surveying current customers, so by now you have a good idea of how your customers feel and who they are. But, where the heck are they? Identifying the channels that are driving people to your site is the best place to start. This will help you understand where your audience is hanging out on the internet, and how you can capture even more of them. The best way to see this in GA is to use the left-hand menu, choose Acquisition, All Traffic and Channels.
Your data will look something like this:
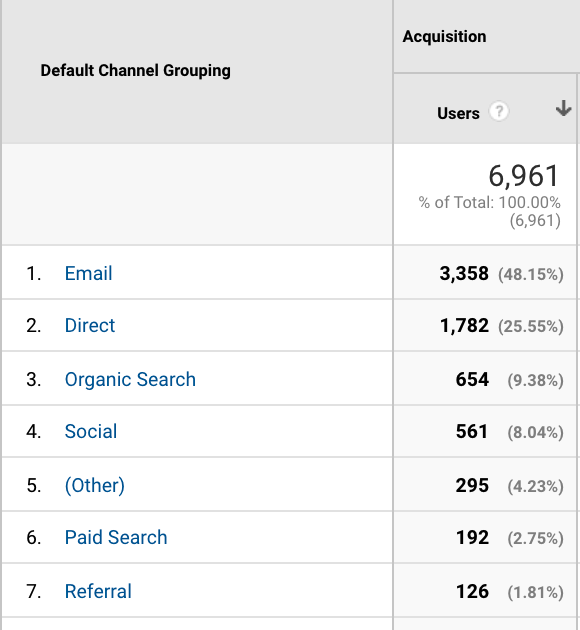
Let’s define some of these channels.
Email Traffic – comes from any email provider (Mailchimp, Gmail, SharpSpring, etc.)
Direct Traffic – comes from someone (an actual person) sharing your website link
Organic Search Traffic – comes from search engines like Google
Social Traffic – comes from any social media platform (facebook, twitter, instagram, etc.)
Paid Search – comes from your Google Ads
Referral Traffic – comes from other websites who have linked to your site
How do I capture more website traffic?
We’ve talked about building your email list to improve email traffic. We’ve also talked about SEO and getting more organic traffic to your site by writing better meta descriptions, including the right keywords in your site, and using headlines. Those are definitely the best way to improve your organic traffic, but here are some other tips:
- Topic Clusters
- Timely Content
- Just Keep Going
Referral Traffic comes from other websites, which means another organization has a link to your website on their site. This is called a backlink. We will dig into this topic next week. Paid Traffic can be improved by optimizing your google ads, and Social Traffic depends on the quality of your social media audience and content.
Dig into Your Traffic Channels to Find Specific Sources
Now that you know where most of your traffic is coming from on a general level, let’s dig into those channels to learn a little more about where your audience is landing on your website and what exactly got them there. We are going to be clicking on each channel to see how the data breaks down. This is what you will see and what you should consider:
- Email – This shows us the specific pages your audience is hitting after clicking through on your emails.
- Direct – Same here. We will see landing pages that people are landing on after being directly driven there by someone other than your company sending them a link in a text, email, print material, etc.
- Organic – This one is a little different. This shows us which keywords are getting people to your site from Google search and other search engines.
- Social – Here we will see which social platforms your audience is coming from.
- Paid Search – This one also shows us keywords that are causing your audience to see your paid Google Ads.
- Referral – Here we will see which websites are driving referral traffic to your website.
Analyze Your Channels to Capture More Traffic
We have quick, easy, and fun homework today. Log into your GA and really dig into and analyze your channel traffic.
Email Traffic Analysis
- Does what you see make sense? Are you linking to these pages in your email campaigns? Consider these pages and make sure there is a clear journey for your audience. Make sure these pages are good pages for them to land on. Whether the purpose is to provide information or get conversions, make sure the journey helps reach your goals.
Direct Traffic Analysis
- What pages are being shared with others the most? Can you improve those pages so that direct traffic sees the best content and sticks around for longer to eventually convert?
Organic Traffic Analysis
- Do these keywords make sense? Do you want to be found for others? Get some tips for SEO here.
Social Traffic Analysis
- You should see the social platforms your company is most active on. See others? Maybe you should improve those channels considering you’re already getting traffic from them and aren’t trying too hard. Imagine what will happen if you put some more effort on those channels.
Paid Search Analysis
- Are some of the keywords you’re targeting not getting any traffic? Maybe you should stop focusing on those. Are some keywords performing like crazy? Maybe you should focus an entire campaign on those keywords. Spend your advertising money where it counts.
Referral Traffic Analysis
- See some you aren’t familiar with? There may be a potential partnership there. See others you are already friends with? Send them a thank you and repay the favor!
Step 2: Look at What Your Customers are Doing on Your Site
Today we’re covering audience behavior as we help complete the picture of how our audience is getting to the site and what they’re doing once on the site. Remember that everything we know about our audience helps us build on our success and move away from activities that aren’t successful. We’re using data to guide the way we market to our audience.
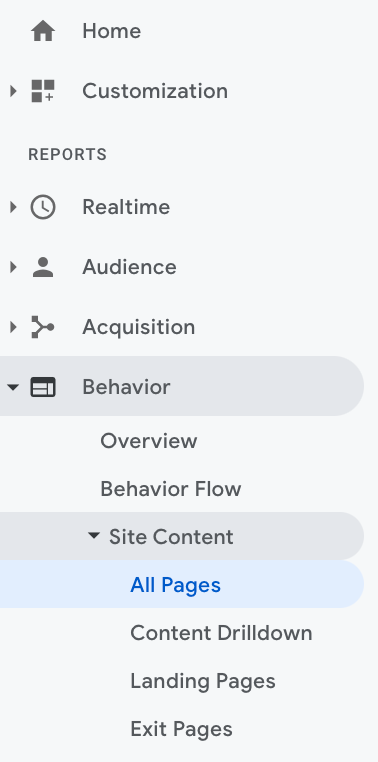
Let’s go ahead and look at that behavior. Log into Google Analytics. Once there, go to Behavior > Site Content > All Pages:
Your data should look something like this:
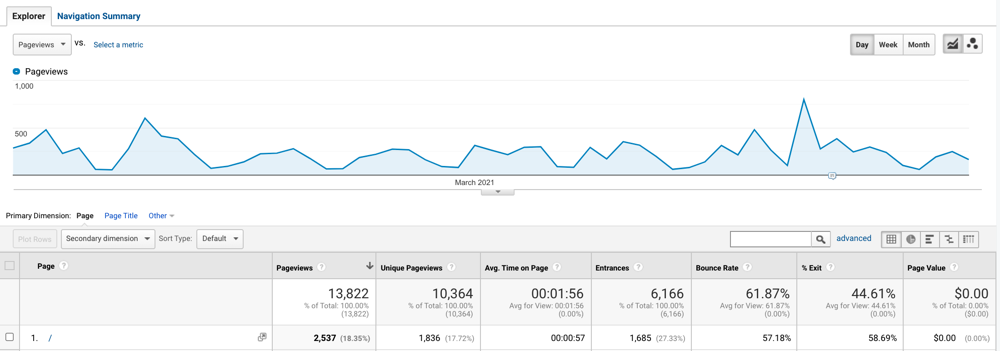

But for right now, here are some simple Kaitlin-language explanations (and frankly, we think they’re better):
- Page – The specific landing page visited
- It’s important to know what your most visited pages are to know where people are landing on your site. The rest of the metrics tell you what actions they are taking, if any.
- Pageviews – The total number of times the page was viewed (not the number of individual people viewing, so duplicates are counted)
- You want a ton of pageviews. The higher this number, the better.
- Unique Pageviews – This is how many sessions the page was viewed by a unique person (or IP address) – duplicates are not counted here
- This tells you how many people are viewing the page, taking out the factor of “maybe they viewed this one page more than once.” Is this number significantly lower than pageviews? Is that a good thing? It depends on your goal for the page. If this is a home page or a content-heavy page, more pageviews will make sense.
- Average Time on Page – The average amount of time spent on the specified page
- This matters for so many reasons. If your page is content-heavy, you want people to stick around and actually read the content, so you want this number to be high. If the page is simply a conversion page with simple text and a CTA for conversion, you might want a lower time on page metric.
- Entrances – The number of times users entered your site through this page (a.k.a. this was the first page they saw on your site for a particular session)
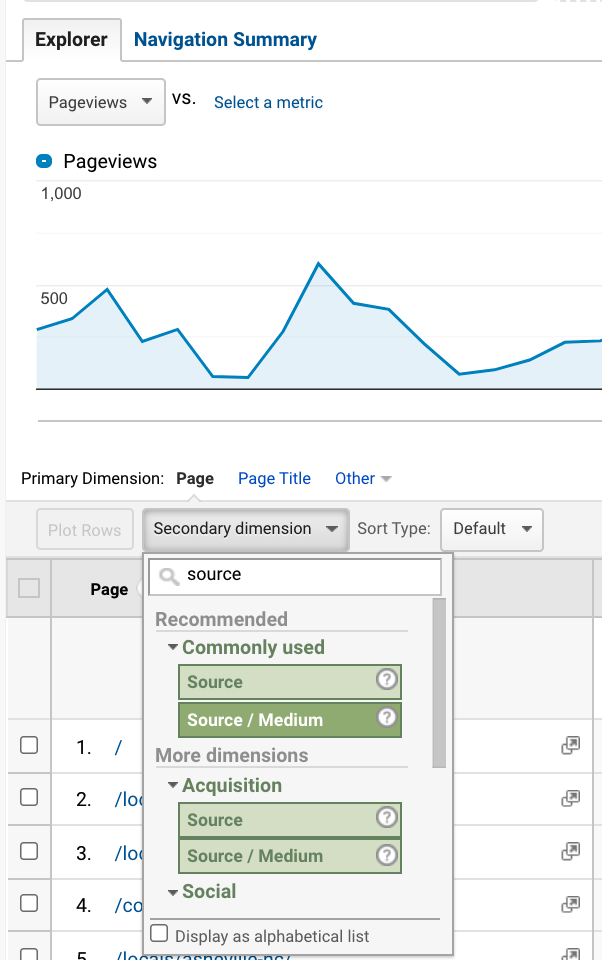
- The top page for this metric will likely be your homepage, or any page that you tend to share a lot on your marketing channels. If you see a page that doesn’t make sense when you filter by entrances, you can dig into this further by adding a secondary dimension of “source/medium” to see where those folks are coming from.
- Bounce Rate – The percentage of sessions where the user only saw this single page for <1 second, and did nothing before leaving. AKA, a bounce is someone clicking over to this page, but leaving immediately after the page loads.
- You want this as low as possible. I suggest looking at industry standards, or simply trying to compete with yourself to lower this number.
- % Exit – This is the percentage of users who exit your site entirely after visiting this page.
- If this number is high for a particular page, make sure that your audience at least had a good experience before exiting. Did they get what they need and move on? Perfect. Or did they not like what they saw, and left empty-handed? Not so great.
Now that you know what you’re looking at, it’s time to analyze your data like your mother-in-law analyzing the crust on the lasagna you made last week. Wait…what? I’m not projecting, you’re projecting.
It’s homework time! Take 30 minutes to do the following:
- Look at your top pages. Are the metrics what you expect or is there anything that stands out as confusing? Look for flags like:
- These aren’t the top pages I thought my audience would be seeing (i.e. your homepage, a landing page you’re promoting on social right now, or a dashboard your clients should use often)
- Are they ready for your audience? Is this landing page and the journey fully fleshed out? Or is this page so-so and not necessarily where you want most of your traffic going?
- What’s the experience like on that page? Is there a clear path that you want the user to take on this page? Is there a CTA that will allow them to convert if they are new, or a button that takes them to their dashboard if they are already a user?
- Are there improvements you can make on your top pages like adding a CTA button or more descriptive language? Make sure the viewers know what this page is about. If it’s an about page, describe your company and your mission in detail. If it’s a product page, make sure that product is the focus. If it’s a contact page, make sure the contact form takes up most of the page’s real estate.
- How is that Average Time on Page. In your opinion is your audience staying on your top page long enough?
- Do you want them to stick around and read the whole page (this would be a good thing to want from content-heavy pages), or do you want them to bounce immediately to go fill out a form and convert? Take note of how long they’re hanging out and start considering actions you can take to keep them there longer.
- How’s that Bounce Rate looking? What can you do to decrease bounce rate?
- Make sure the channel that people are using to reach this page is descriptive of your landing page.
- People don’t want to be confused, they want to see what they expect to see when going to a website. Give that to them, and they will stick around.
- Make sure your page is engaging without needed to scroll through it. Add a video or something that might catch attention quickly.
Step 3: How to Create a Google Analytics Custom Report
We’ve walked through two reports: Top Channels and Top Pages. You know how to get to those on your own and dig a little deeper for analysis on the data you find there. But, you know what’s even better than going into Google Analytics to find this information anytime you want? Getting it automatically sent to your inbox on weekly, bi-weekly, or monthly basis so you don’t have to spend 30 minutes every week or month digging through the tool yourself.
Today we’re talking about three reports that I think matter to your business and will give you a good idea of where you are in space and time. There is another report from Google Search Console that we will dive into next week, but that’s next week. Let’s focus on the now.
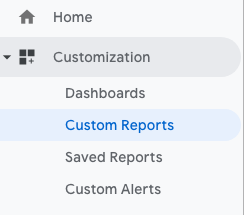
Log into GA, go to Customization > Custom Reports > + New Custom Report
Follow these directions. Give your report a title. I suggest including the frequency at which you will want these to hit your inbox. Also add these 3 report tabs:
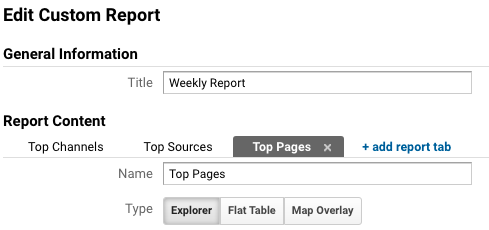
There are also a few different report types. For today, we are sticking with Explorer, because that’s the type of data you’ve already become familiar with in GA.
Now it’s time to add metrics and dimensions for each report. The good news is that these are looking very familiar by now. I’ve included screenshots of the metrics and dimensions for each report tab below.
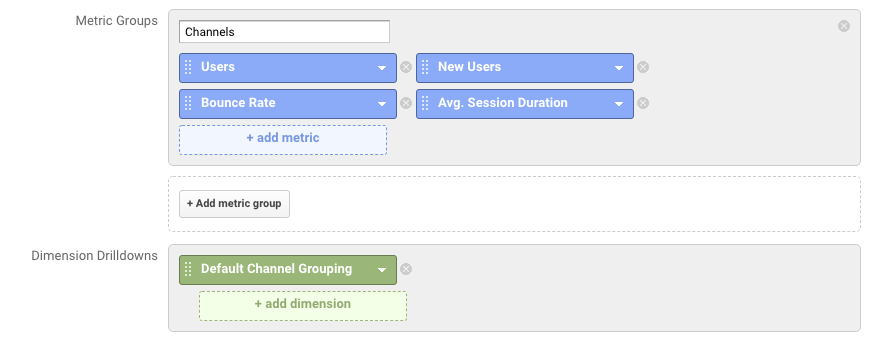
Top Channels
Remember, this report is important because you want to know where your audience is coming from. When you know what channels they hang out on the most, you can focus your efforts there.
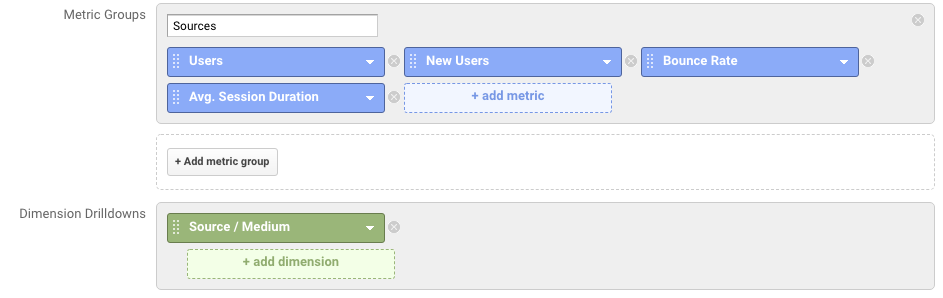
Top Sources
Sources are simply a drill down into the channel. For example, if the channel is Referral, the source/medium might be a partner’s website, an organization’s website, or a message board your audience hangs out on. This will allow you to know which partners are worth spending a little more time with, and which ones aren’t really helping you out as much.
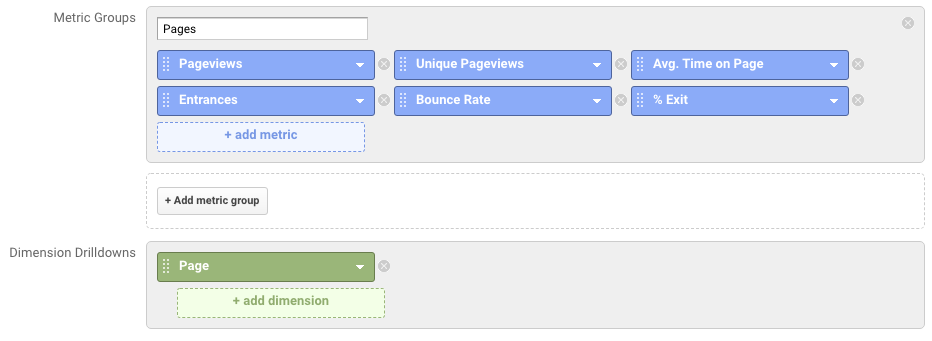
Top Pages
Your top pages tell you what your audience is doing once they make it to your site. Remember to analyze these pages and make sure you are putting your best foot forward by optimizing the page content for conversions or a lower bounce rate.
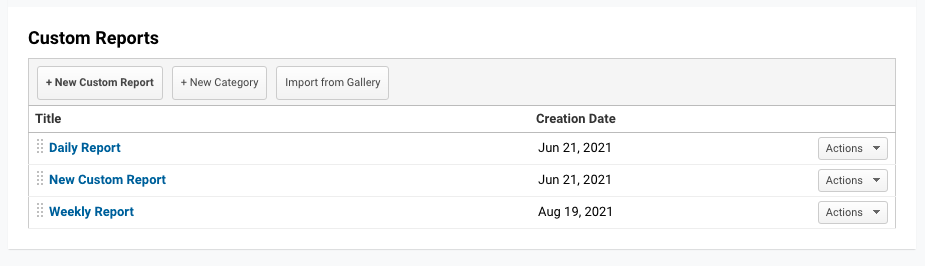
When you have all of these done, click “save” at the bottom of the module. Now, go back to Customization > Custom Reports and you should see your new Weekly Report:
Click on your report, and GA will populate it for you. At the top of that screen, click “Share” and choose your frequency:
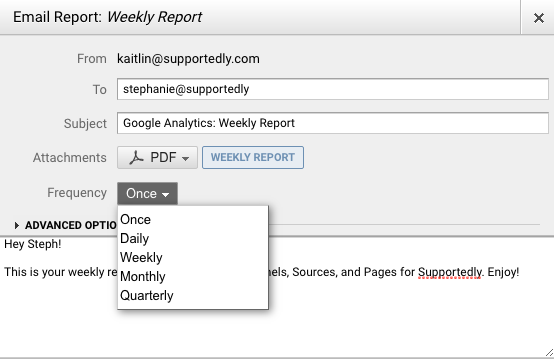
And that’s it! Make sure you recieve your new report in your inbox at the designated frequency. If you do not receive it, take these same steps and check to make sure you entered your email address correctly.
Share this Article!
Want to write an article for our website? Learn more and submit a guest blog here.